Wireshark is by far one of the most used tools among all I have in my arsenal. Its is my goto tool once I decide to open the trunk of a protocol and see exactly what is going on inside the wire. Let me start off by stating that this is very much a rabbit hole of learning. To master WireShark is to master not only your hardware and software skills but to get an in-depth understanding of the protocols used by these systems. Just because it can is a complicated endeavor to explain EVERYTHING that this piece of software does I will occasionally link to outside sources for more information. The objective of this post is to introduce you to a piece of software I happen to love, get it installed, and get you practicing. Wireshark is not something learned overnight and no amount of tutorials could ever cover all it does. Like most things however a little bit of practice and perseverance goes a long way.
Here are just SOME of the features posted on wiresharks website which show off just what this little beast can do.
- Deep inspection of hundreds of protocols, with more being added all the time
- Live capture and offline analysis
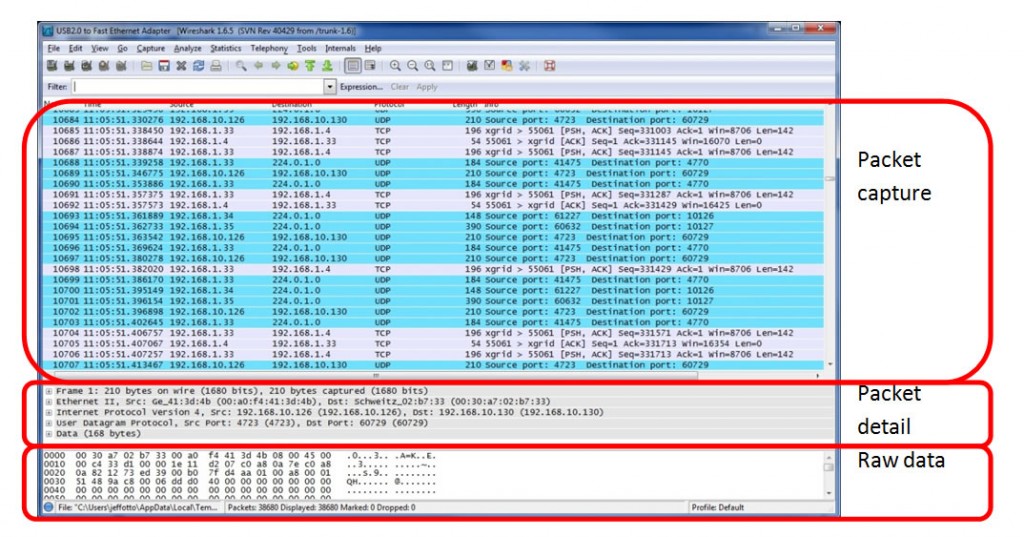
- Standard three-pane packet browser
- Multi-platform: Runs on Windows, Linux, OS X, Solaris, FreeBSD, NetBSD, and many others
- Captured network data can be browsed via a GUI, or via the TTY-mode TShark utility
- The most powerful display filters in the industry
- Rich VoIP analysis
- Read/write many different capture file formats: tcpdump (libpcap), Pcap NG, Catapult DCT2000, Cisco Secure IDS iplog, Microsoft Network Monitor, Network General Sniffer® (compressed and uncompressed), Sniffer® Pro, and NetXray®, Network Instruments Observer, NetScreen snoop, Novell LANalyzer, RADCOM WAN/LAN Analyzer, Shomiti/Finisar Surveyor, Tektronix K12xx, Visual Networks Visual UpTime, WildPackets EtherPeek/TokenPeek/AiroPeek, and many others
- Capture files compressed with gzip can be decompressed on the fly
- Live data can be read from Ethernet, IEEE 802.11, PPP/HDLC, ATM, Bluetooth, USB, Token Ring, Frame Relay, FDDI, and others (depending on your platform)
- Decryption support for many protocols, including IPsec, ISAKMP, Kerberos, SNMPv3, SSL/TLS, WEP, and WPA/WPA2
- Coloring rules can be applied to the packet list for quick, intuitive analysis
- Output can be exported to XML, PostScript®, CSV, or plain text
As you can see this tool supports many capture formats, access abilities and platforms. This write up will shine a light on simply the basics with future posts going deeper into the subject.
Installation
Linux
aptitude install wireshark
or
apt-get install wireshark
Windows
Simply download the Wireshark installer from: https://www.wireshark.org/download.html and execute it. Official packages are signed by the Wireshark Foundation. You can choose to install several optional components and select the location of the installed package. The default settings are recommended for most users.
There are so many platforms which support wireshark that the best place to check is here, the softwares provided installation manual broken down depending on OS.
Time to tinker
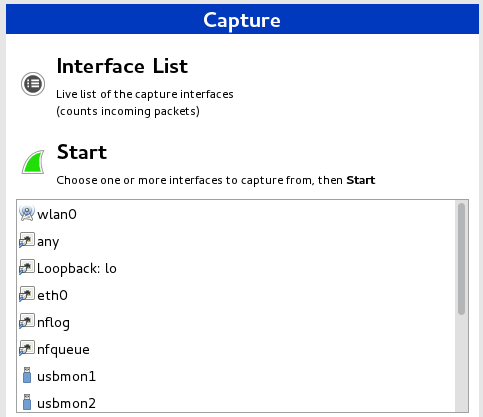
After downloading and installing Wireshark, you should then launch it and click the name of an interface under Interface List to start capturing packets on that interface. Under Linux it is not advised to run Wireshark as root, the installation will ask you if you want to setup a special group, we recommend you do just that.
 As soon as you click the interface’s name, you’ll see the packets start to appear in real time. Wireshark will capture each packet sent to or from your system. In the case that you’re capturing on a wireless interface and have promiscuous mode enabled in your capture options, you’ll also see other the other packets on the network.
 You’ll probably see packets highlighted in green, blue, and black. Wireshark uses colors to help you identify the types of traffic at a glance. By default, green is TCP traffic, dark blue is DNS traffic, light blue is UDP traffic, and black identifies TCP packets with problems.
Custom rules can also be made to highlight JUST the packets your interested in. There are two types of coloring rules in Wireshark: temporary rules that are only in effect until you quit the program, and permanent rules that are saved in a preference file so that they are available the next time you run Wireshark. Temporary rules can be added by selecting a packet and pressing the Ctrl key together with one of the number keys. This will create a coloring rule based on the currently selected conversation. It will try to create a conversation filter based on TCP first, then UDP, then IP and at last Ethernet. Temporary filters can also be created by selecting the → menu items when right-clicking in the packet detail pane. To permanently colorize packets, select →
Here are some coloring rules provided by the Wireshark wiki.
Filtering those packets
If you have specific traffic you’re interested in inspecting, it helps to close down all other applications using the network so you can narrow down the traffic. Still, you’ll likely have a large amount of packets to sift through so we narrow your aim using filters.
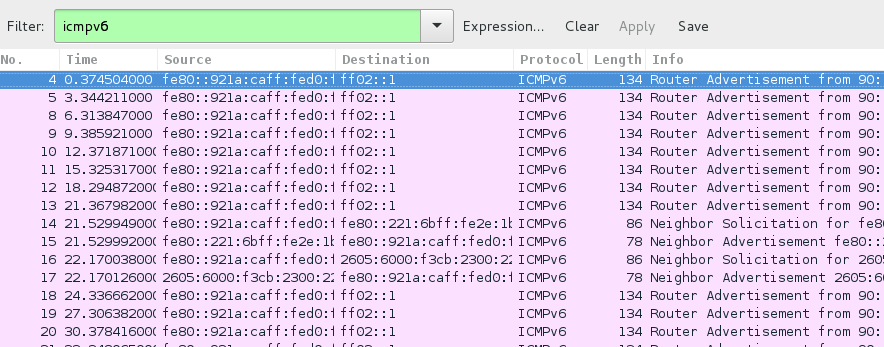
The most basic way to apply a filter is by typing it into the filter box at the top of the window and clicking Apply (or pressing Enter). For example, type “icmpv6” and you’ll see only opv6 packets. When you start typing, Wireshark will help you autocomplete your filter so its quick to find exactly what your looking for.
Once you get the basics of capturing and analyzing the data it becomes easy to listen in on just about any conversation your network is having. For some added fun, right click a packet and click “follow stream” to follow the conversation your machines are having. Practice with some Sample Captures if your network isn’t exactly interesting. If your really up to the challenge Netresec hosts a great collection of public pcap files that cover everything from malware live on the wire to CTF traces from Defcon CTF contests.
Links


0 comments